



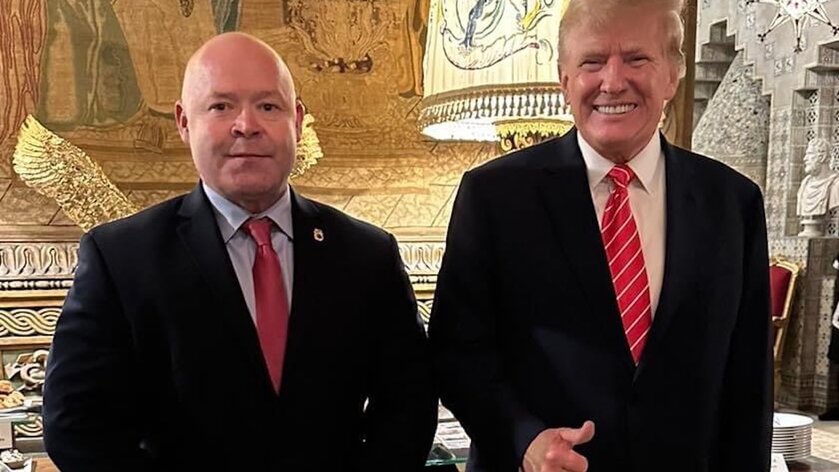
On Wednesday, President Donald Trump met privately with Teamsters General President Sean M. O’Brien ahead of a rank-and-file roundtable this month. In a post on X (formerly Twitter), the influential labor organization said it was "an in-depth and productive discussion on worker issues most important to the Teamsters Union."
“There are serious issues that need to addressed to improve the lives of working people across the country, and the Teamsters Union is making sure our members’ voices are heard as we head into a critical election year,” O’Brien said. “We thank the former President for taking time during this private meeting to listen to the Teamsters’ top priorities. And we are eager to bring together the rank-and-file for an important and necessary roundtable with President Trump this month.”
Democratic users and influencers on the social media site were quick to criticize the union in a flurry of replies and quote reposts. But while X is "real" as opposed to "fake" in a broader context, it is hardly representative of an electorate or even an organization.
So, what does the data say about the viability of this potential relationship?
In 2016, the then-Republican nominee for president did very well with unions, more specifically private sector unions. National Exit Polls (NEP) conducted by Edison Research found Hillary Clinton carried union households by just 5 points, 51% to 46%. President Trump carried all non-union households by a 6-point margin, 48% to 42%.
But in 2020, Democrats leaned on leadership to put the screws to rank-and-file members, much like they are in the replies here, and union support for the then-incumbent eroded. In our most recent poll conducted in December, all union households told us they voted for President Biden over President Trump 57.5% to 36.6%, a nearly identical margin (56% to 40%) published by the exit polls. Given subgroup sampling errors are higher, it's more than safe to concede the result is representative.
In addition to collecting surface-level data on union versus non-union households, BIG DATA POLL also collects data by union type: public, private, and both (dual). For the record, non-union voters back President Trump over President Biden 52.5% to 47.5% after essentially splitting their vote in 2020, a result also identical to the exit polls.
Private sector unions who claimed to have voted for President Biden 54.6% to 37.0% now only back him 51.5% to 48.5%, a significantly narrower margin fueled by both a decline in support for the current president and a significant gain in support for the former. The margin among all union households is starting to more closely resemble 2016 than 2020. Considering the survey overstated support for the Democratic candidate, there is a good argument to make that President Trump is now performing even stronger against President Biden than he did against Mrs. Clinton among union households.
While public sector union voters obviously are more likely to maintain support for President Biden—still backing him 57.8% to 42.2%—his advantage is slightly narrower than the 59.6% to 36.9% edge he held over the former president in 2020. Moreover, dual households actually break for President Trump 53.1% to 46.9%, though sample size for this subgroup is small. Undecideds voters from all three household types actually break for the 45th President when leaned.
President Trump has reportedly committed to another roundtable sit down with rank-and-file Teamsters, General President O’Brien, and General Secretary-Treasurer Fred Zuckerman in January. The event will be held at the Teamsters’ international headquarters in Washington, D.C. Despite what social media interactions might suggest, the data clearly indicates this is a no-brainer.
The International Brotherhood of Teamsters has more than 1 million members nationally and a not-so insignificant number in several key battleground states. Further, the organization has known its fair share of government persecution, fair and unfair. Politics make strange bedfellows and we've seen stranger. But in this case, a potential relationship would not only seem to be a good fit, but a politically smart move.